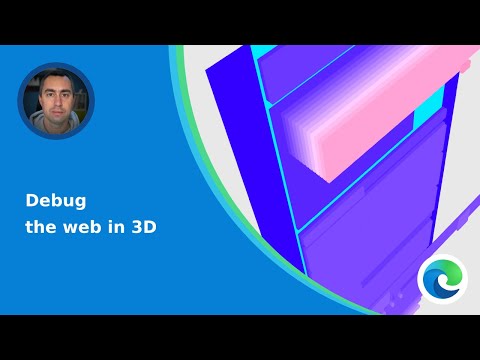
Microsoft has announced some nifty improvements to the 3D View tool that is part of the Development Tools (Dev Tools). The tool is getting quite a few performance enhancements that should help Web Developers spot, address, and improve multiple elements which collectively make a website.
The 3D View tool has been very useful while visualizing and solving common web development challenges such as DOM complexity, unwanted scrollbars, or z-index stacking issues. The 3D View tool, as well as the DevTools, are obviously not meant for the average web user. However, those who already use the development tools should benefit from new features, assured Microsoft.
Some of the new features that Microsoft has incorporated within the 3D View tool are as follows:
Quickly view page complexity:
The 3D View tool has always been one of the fastest ways to find deeply nested containers. The DOM tab of the 3D View tool quickly reveals the DOM tree in 3 dimensions and helps developers discover which part of your page may have too many wrappers.
The DOM tab of the tool also gives developers an overall view of the entire web page and allows them to zoom out and pan around the scene until the elements that are out of the viewport become visible. Clicking one of the elements lets developers jump straight to the Elements tool.
Debug z-index stacking issues:
The 3D View tool has a Z-index tab that makes investigation simpler and intuitive. The tool makes it possible to see which elements are stacking contexts and how elements are stacked along the z-index axis. This can help to quickly find common issues.
Debug performance issues with Composited Layers:
This new feature breaks down a webpage in the correct or optimized number of layers. This significantly improves performance, especially when some components are animated or changing independently of the rest.
Microsoft has added a new Composited Layers tab to discover the layers that were created. In the sidebar on the left-hand side, the list of layers is displayed, and hovering over each of them highlights it in the 3D scene. The panel will highlight important information about the layers such as the size and memory needed to render the same.
