Last month, Microsoft integrated its Teams activity feed with Power BI. Yesterday, the tech giant released a new Power BI component focused on making life easier for developers utilizing Angular for web apps.
Today, a new announcement has been made regarding Microsoft"s data analytics service, this time related to an update to one of its in-service offerings. More specifically, the in-product store provided in Power BI - AppSource - is getting an enhanced visuals browsing experience.
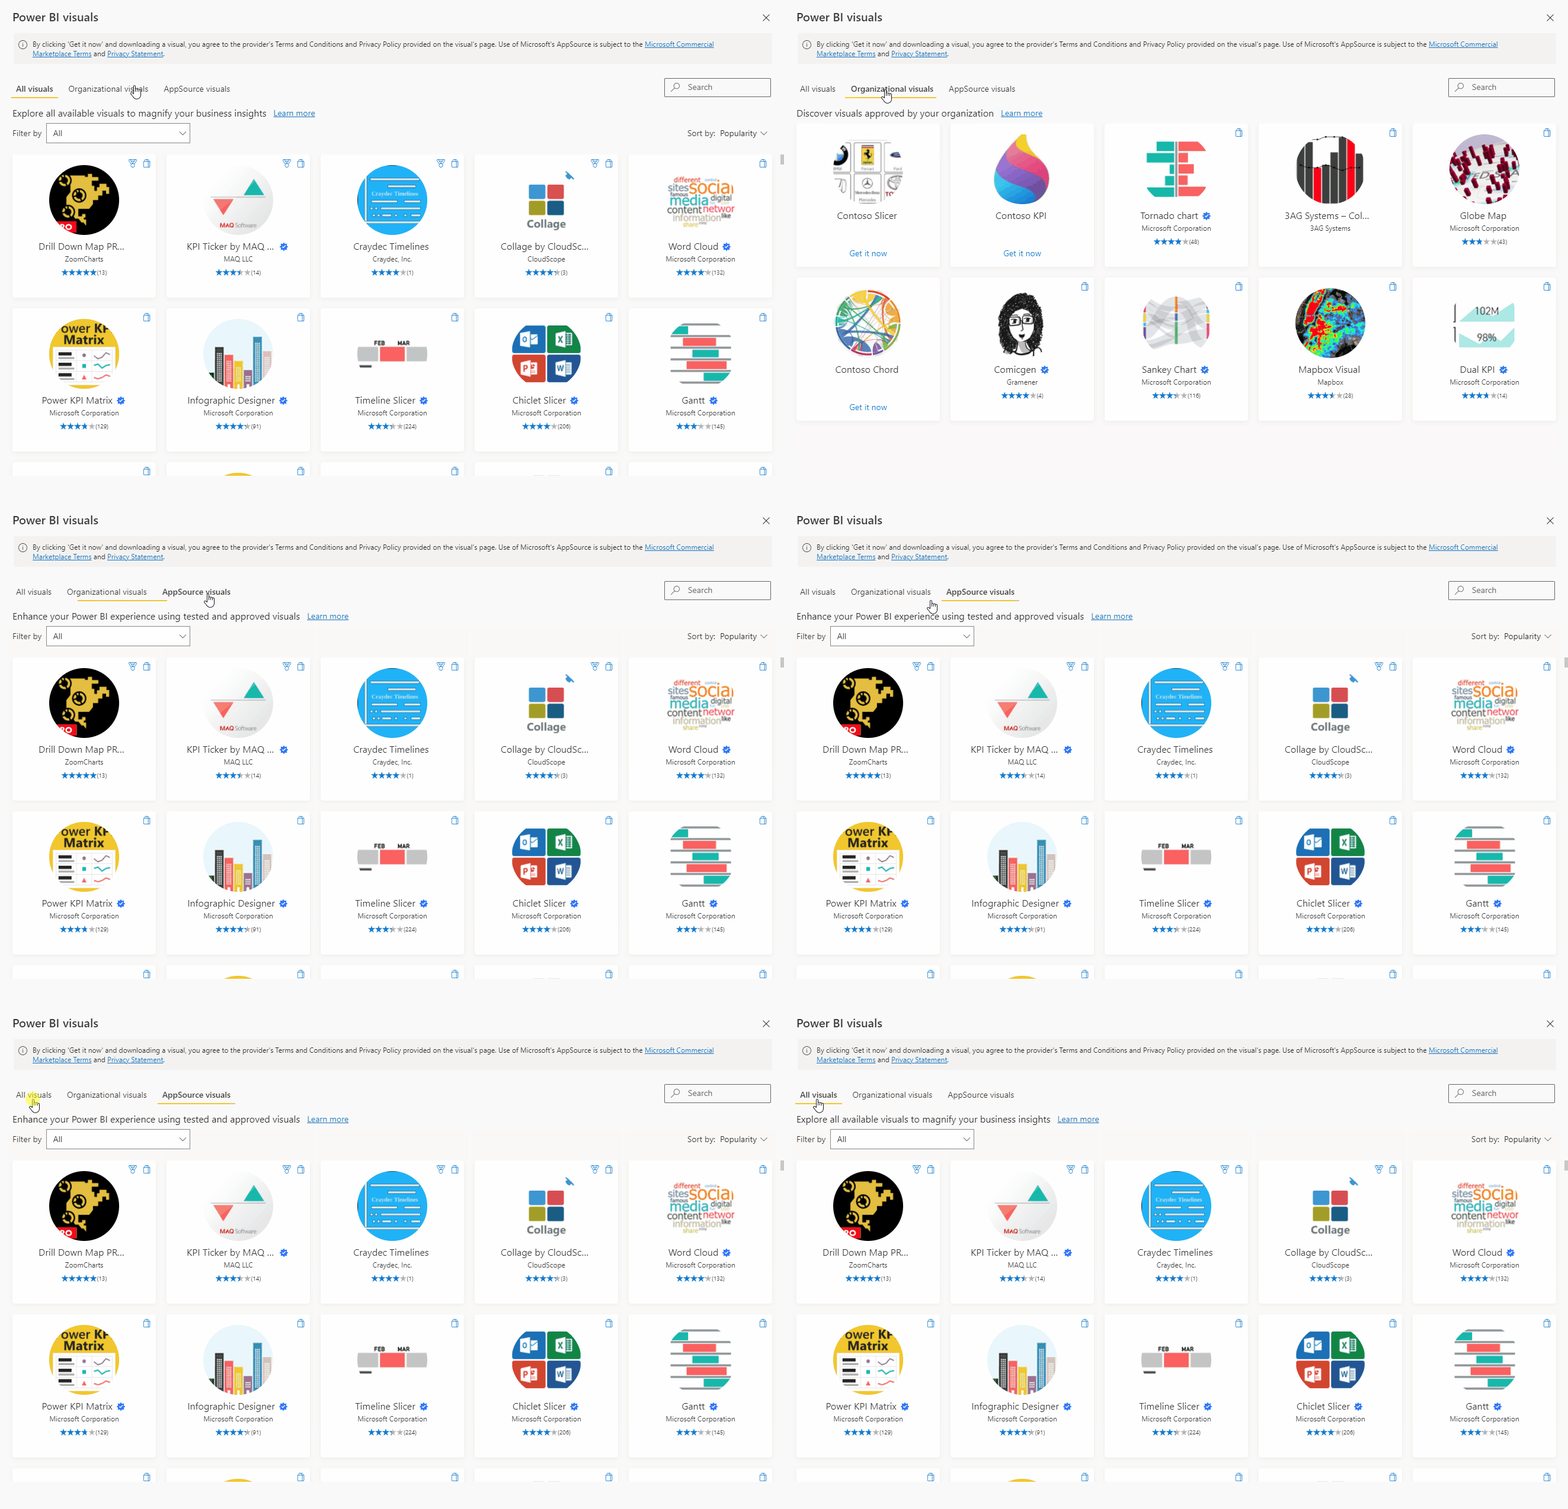
Most significantly, separate tabs have now been created for visuals. These allow users to switch between a unified view for all visuals, visuals offered by their organization, and AppSource visuals with ease, requiring only a single click for each such operation as shown below.
Aside from that the new experience showcases further improvements as well; these are as follows:
- Filter by menu: Find the best visual that meets your needs by filtering by a category. Today we have 8 different categories categorizing the visuals based on the publisher selection.
- Improved search bar: We’ve also improved the search so that you can go deeper. You can now search by publisher name or by visual name to find what you need faster.
- Sort by menu: We enhanced the sort by menu to allow you to sort on the visuals according to your preferences.
This update will be arriving in the August desktop release for Power BI. The full library of AppSource visuals is not only available in the in-product store, but can be accessed through the web page here too.
