In the last couple of years, we have seen PC hardware take enormous leaps, both in terms of performance and efficiency. While this is great for the average consumer, the increase in performance also has a negative impact in terms of the heat generated as well as the power consumption.
So, if you are the sort of person who likes to monitor your system's vitals, then we have a tutorial for you. It'll tell you how to add a second display to your PC to monitor temperature, power consumption, and the frequency at which the hardware is running. Do note that this may require modding your hardware, so proceed at your own risk. With that out of the way, let's see what hardware you will need to complete the setup.
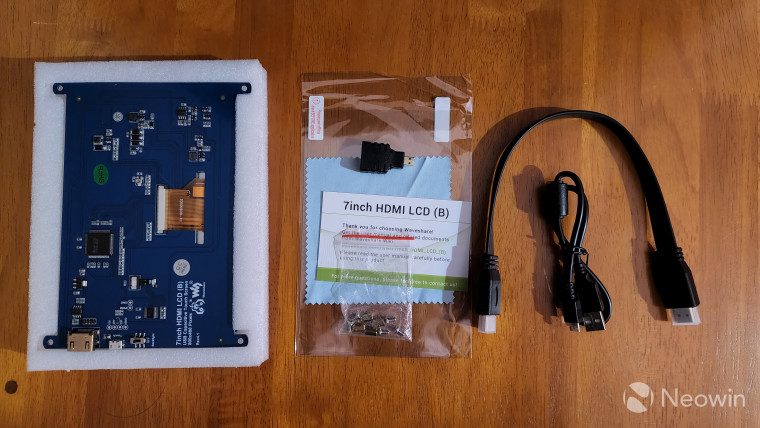
Off the bat, you will need a screen to display the various data points. For this, we would recommend going with one of the displays made for Raspberry Pi, as they are relatively cheap and come with the basic features that you will need. Do make sure you buy a display that supports output via PC as well. Some displays only support Raspberry Pi and that will not help you as we will be connecting the display directly to the GPU.

Unfortunately, there is no good recommendation for displays, as these vary widely based on the region and the manufacturer. You can check the Raspberry Pi website or Amazon to find the best display suited for your needs. As for size, make sure you get one that fits in your case, but I found five to seven inches to be the ideal size. Anything bigger than that is just a waste of space inside your case.
Moving on, you will also need a screwdriver and a couple of stand-offs, however, the latter is optional as some displays come with their own set of mounting hardware including stand-offs. If you don't have stand-offs available, you can also use the extra ones that came with your motherboard. Alternatively, you could also mount the display outside the case if you don’t have enough space inside or if you are like me and have a case with tinted side panel.

Before mounting, do check the back of the screen as some displays come with a physical on and off switch which will be hard to reach once you mount the display on your case.
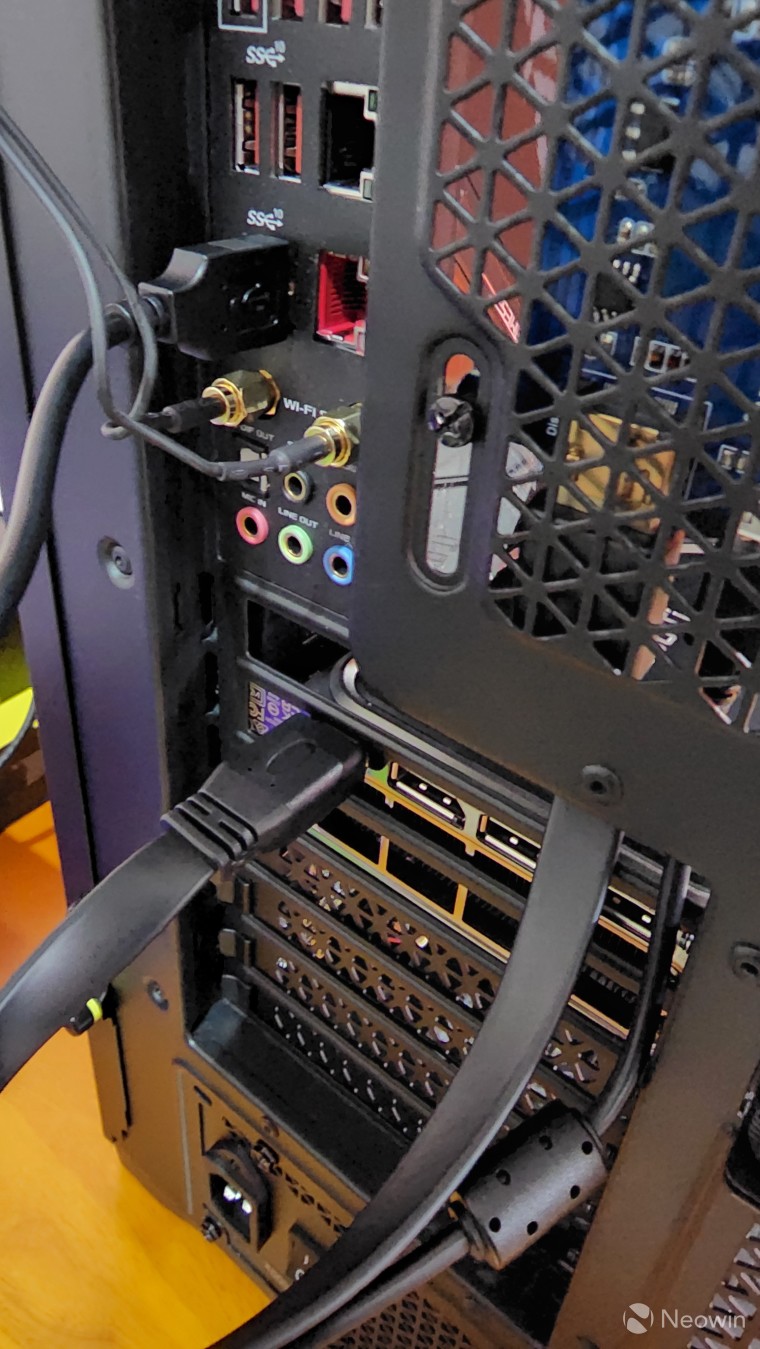
Once mounted, you will need to run two cables – HDMI input and USB power cable. Since my monitor has a USB pass-through, I connected the display to the monitor to reduce cable clutter. You can, however, connect the cable to a USB port on your motherboard. Next up, connect the HDMI cable from the display to your GPU. Make sure you are connecting the cable to your GPU and not your motherboard (unless you are using onboard graphics instead of a discrete GPU).

Once the setup is done, your display should power on. Before setting up monitoring, there are a couple of settings we need to modify on Windows. Firstly, head to Settings > System > Display and set the ‘Display Resolution’ and ‘Display orientation’ according to your preference. While you are in there, ensure you have selected ‘Extend these displays’ from the dropdown in the top right corner.
_story.jpg)
Next, head to Personalization > Taskbar and uncheck ‘Show my taskbar on all displays’ under Taskbar behavior. This will hide the taskbar from the second screen.
_story.jpg)
Once done, you are ready to move on to the next part and configure hardware monitoring. Make sure you download AIDA64 before moving forward, as we will be using it to set up monitoring on the second display.
Once you have downloaded AIDA64, open the app and navigate to File > Preferences > Sensor Panel. Now check ‘Show Sensor Panel’ and define the resolution in the Sensor Panel size. You should match the resolution with the resolution of your display and the orientation to the right size panel. You can also define the background color here, but by default it will be set to blue. Once done, hit apply to save the settings and close the dialog box.
_story.jpg)
Now you can right-click on the panel and select sensor panel manager. This will open another window where you can configure all the settings and add various widgets. By default, AIDA64 provides a couple of widgets, but you can either delete them or customize them as per your requirements. To add a new widget, right-click on an empty space on the sensor panel and select ‘New’.
_story.jpg)
This will open another window and here in the item type, you can select what type of widget you want to add. Some options you can use include graph, gauge, and static text. Once selected, you can select the sensor in the general tab. This includes system sensors like CPU utilization, GPU utilization, clock speeds and more. Further down, you will also get options to show the power usage, cooling fans, power output and temperature.
_story.jpg)
If you have selected the sensor item on the top, then you will have various options to define the unit of measurement and the bar graph format.
In order to move an existing widget, you will need to right-click on the widget and select move and place it where you want it to show. AIDA64 has decent customization options when it comes to graphs and gauges, so you can personalize it the way you want.
One thing to note here is that while AIDA64 has an option to add FPS, it relies on RTSS to show FPS data. So, if you are planning to use FPS on the panel, then make sure to download RTSS and ensure it opens on startup along with AIDA64.
Coming to the performance penalty of setting up monitoring on your system, on average, AIDA64 and RTSS combined use 100 MB of RAM and less than 1% of my CPU. To be honest, I have not noticed any issues while running both in the background or letting both of them launch at startup. In the interest of full disclosure, I am running a Ryzen 5900x which is paired with 32 GB of RAM and RTX 3080Ti, so your mileage may vary. That being said, I did try running both on my old laptop with 1060 GPU and 8 GB of RAM and did not see noticeable difference in performance. You can always uninstall both the programs if you see a difference in performance.
.jpg)
AIDA64 provides a lot of options to choose from, so you can customize it as per your desire. I have, however, uploaded my design, so you can import it if you want to use it. To import a design, open sensor panel manager and select ‘Import’ in the top right corner of the screen.


7 Comments - Add comment